State of Indian Infrastructure 2026
The money, the pipeline, and the contractors behind India's largest-ever build. Twelve pages, 30+ figures, every one traced to a primary government source.
Sourced from PIB · MoRTH · NHAI · DPIIT · MoSPI · ICRA
India builds at scale. This is the top line.
That is the surface. The full breakdown, capital outlay by year, the ₹185 lakh crore NIP split, contractor order books, and the WPI cost curve, is charted across the report. Get it free.
Twelve pages. Ten questions, answered with sourced numbers.
Executive snapshot
Six numbers that frame the build, and the read for contractors.
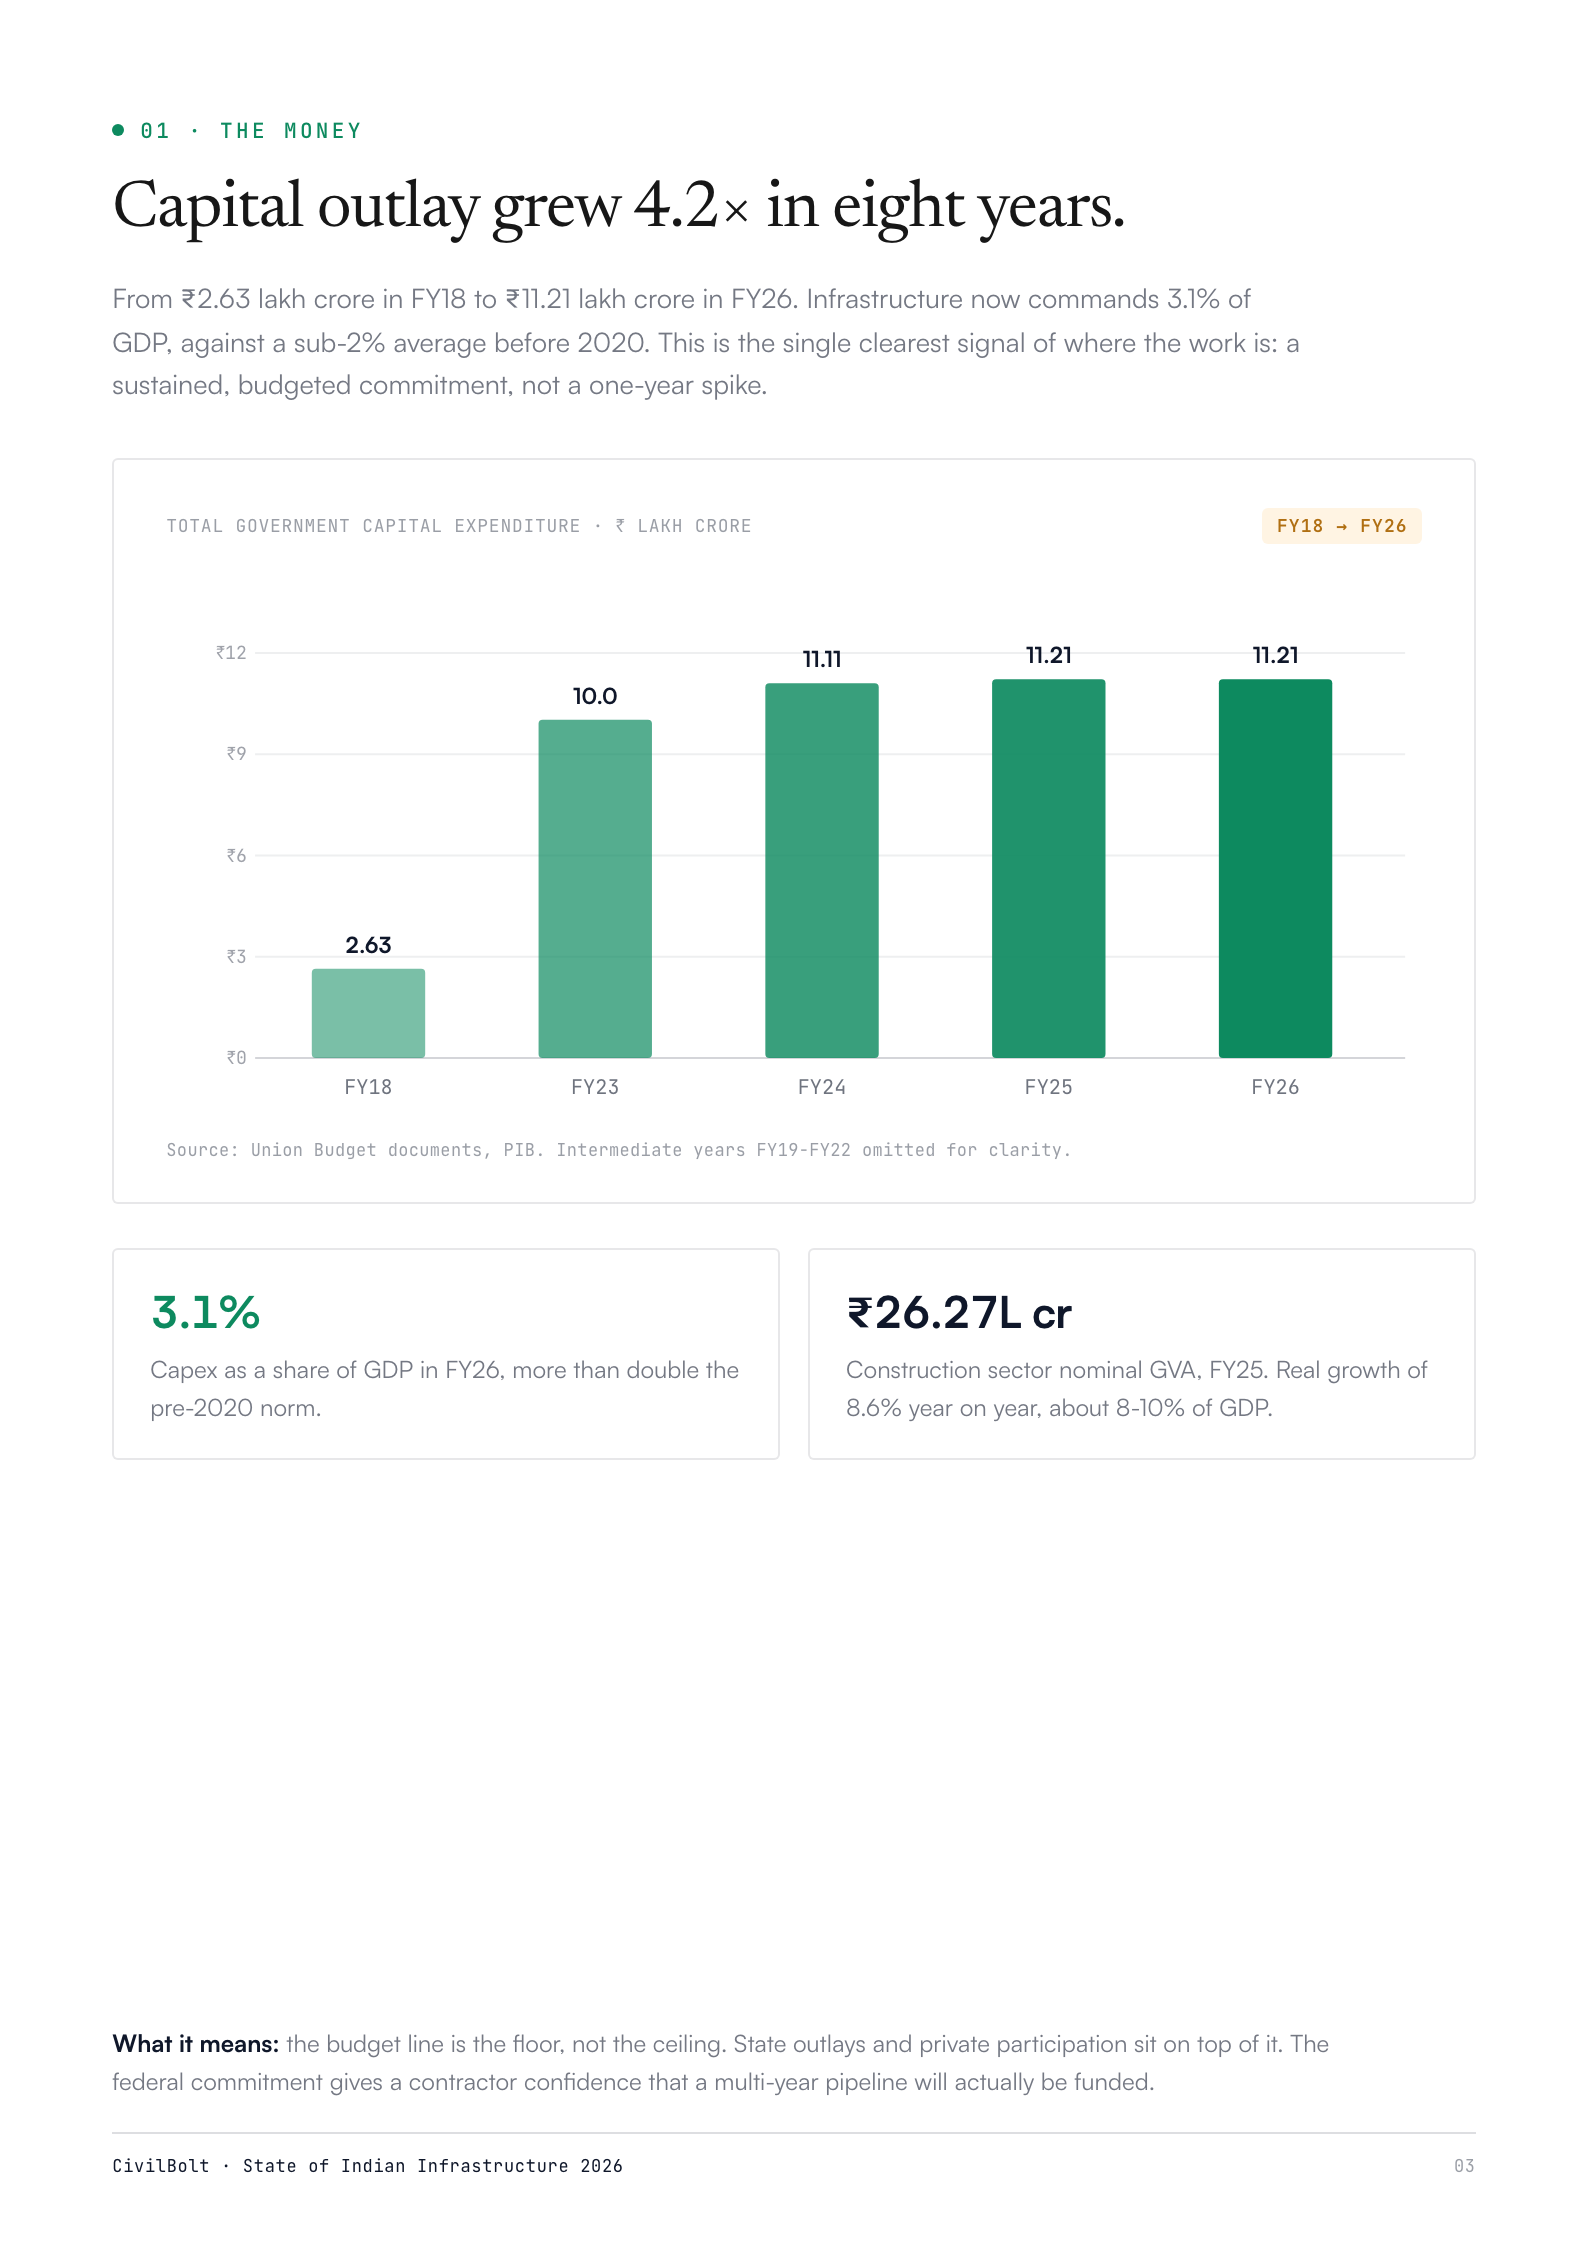
The money
Government capital outlay, FY18 to FY26, and its share of GDP.
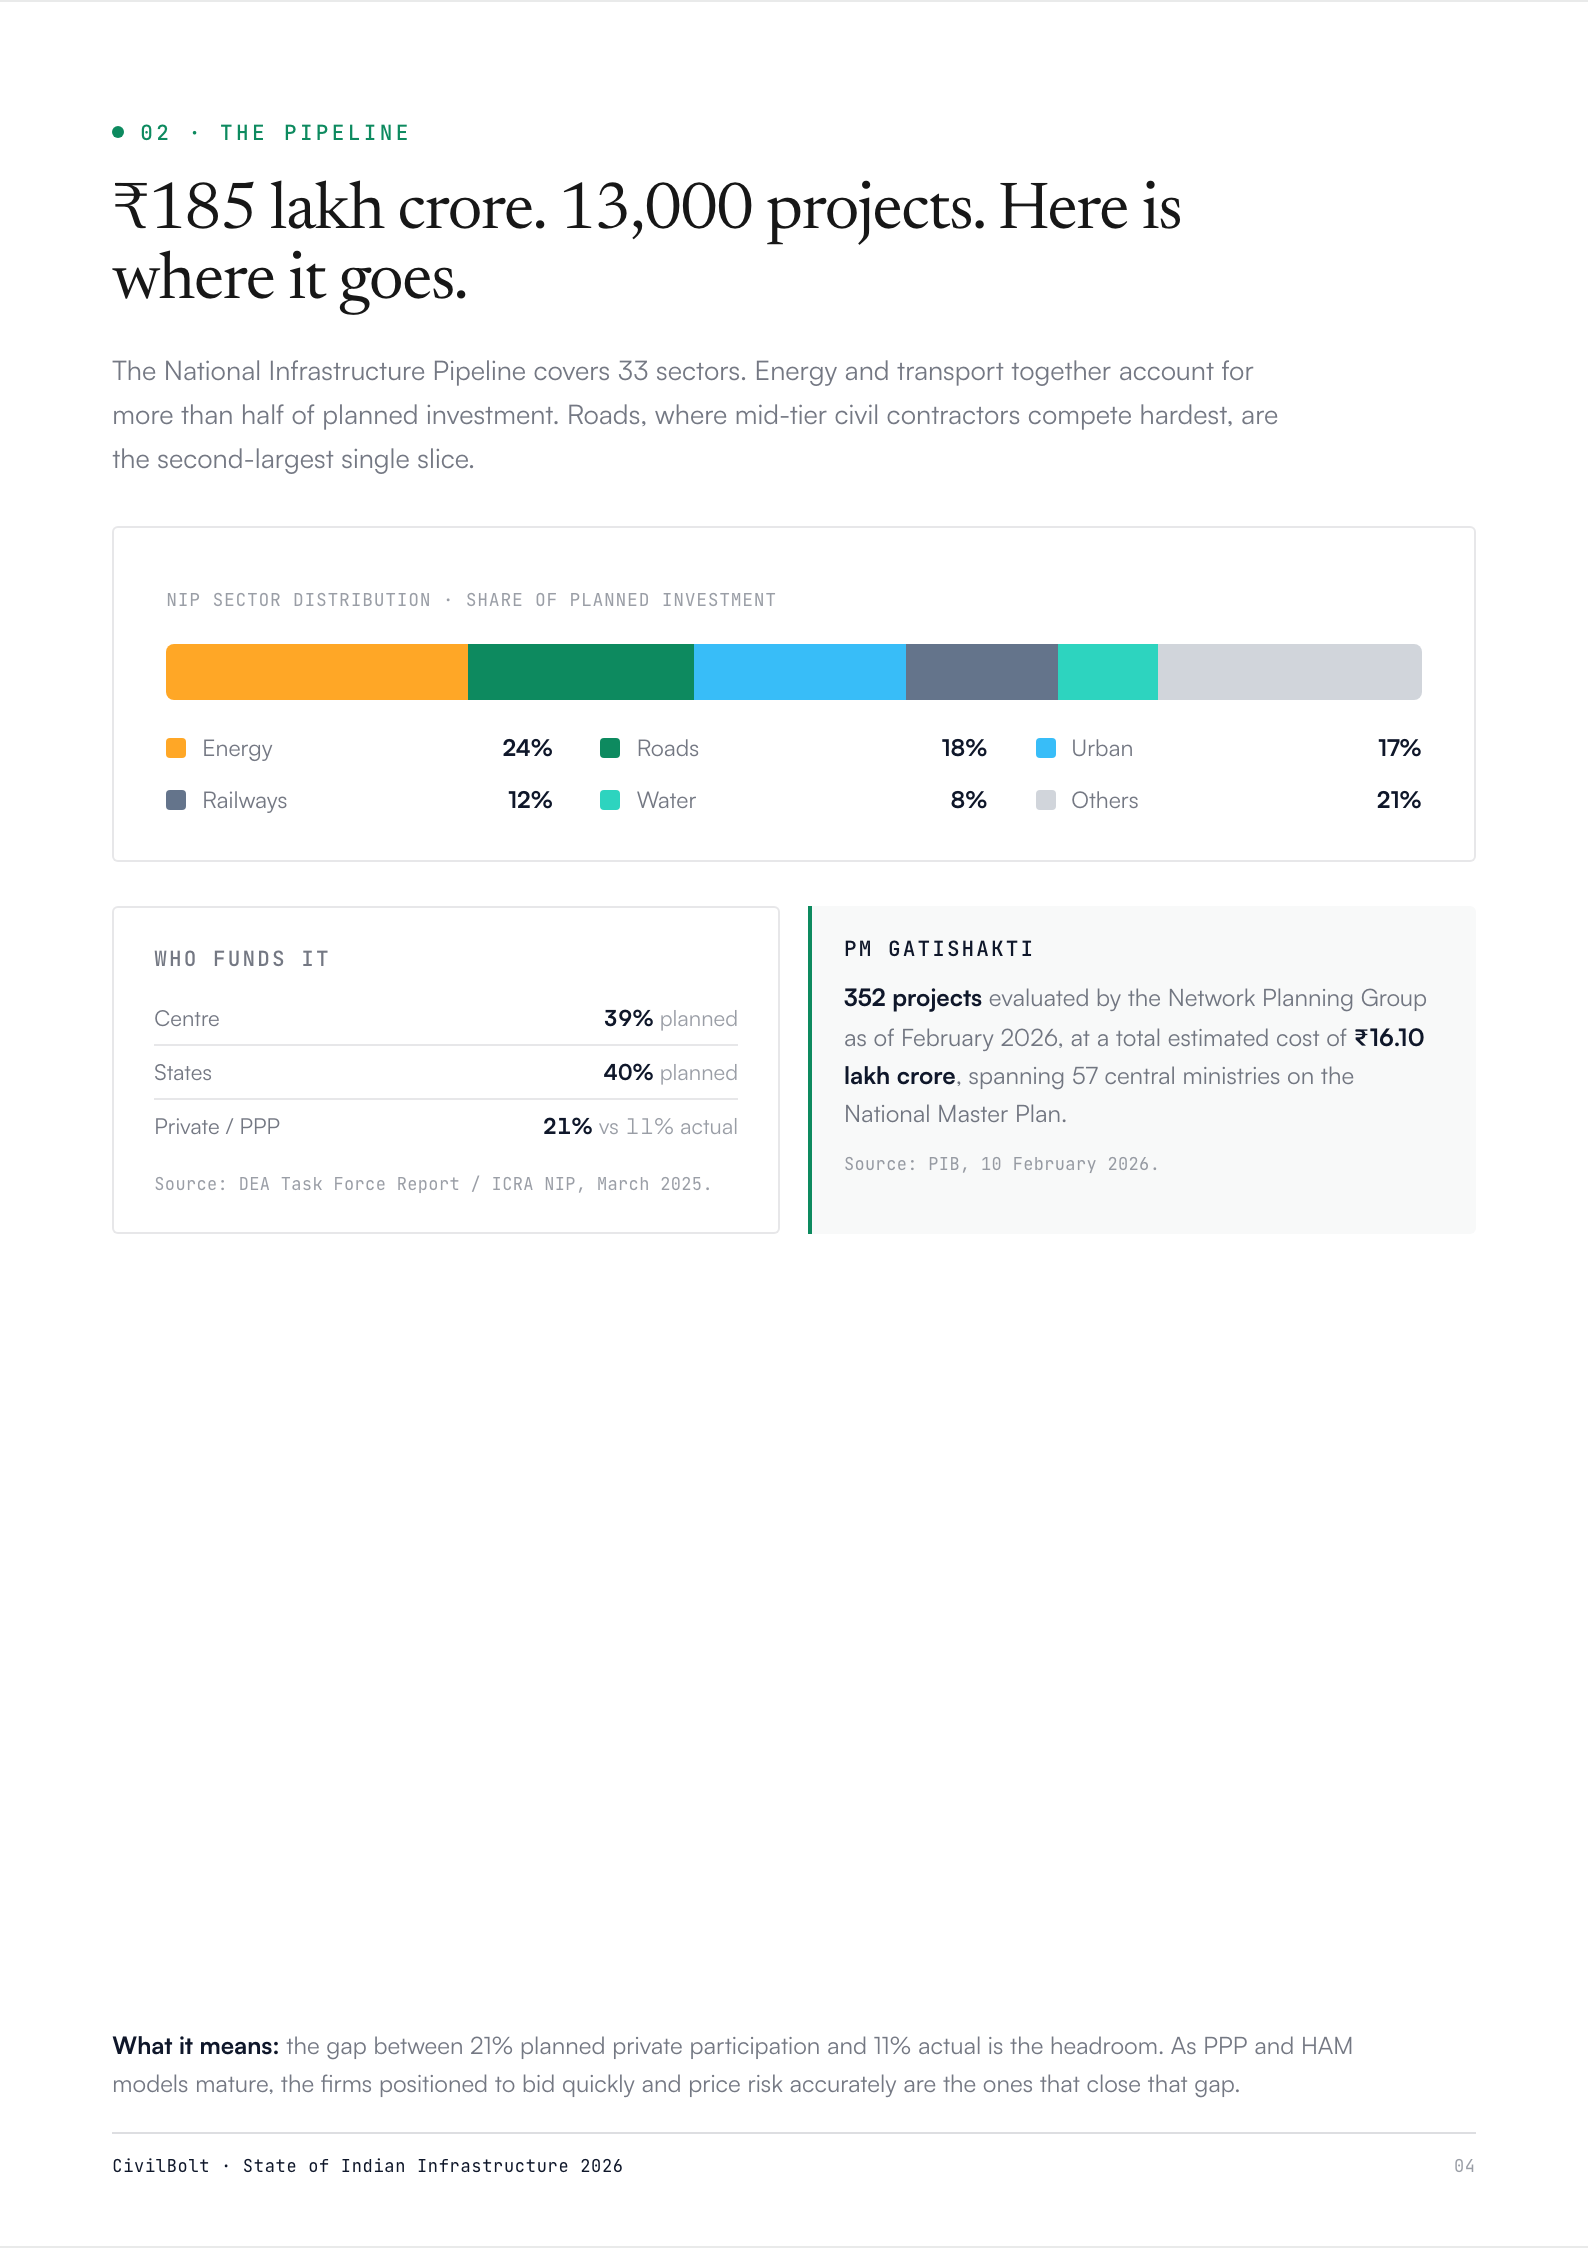
The pipeline
The ₹185 lakh crore NIP, sector by sector, plus PM GatiShakti.
Roads & highways
Network growth, Bharatmala completion status, construction rate.
Who's building it
Contractor order books for FY25, ranked.
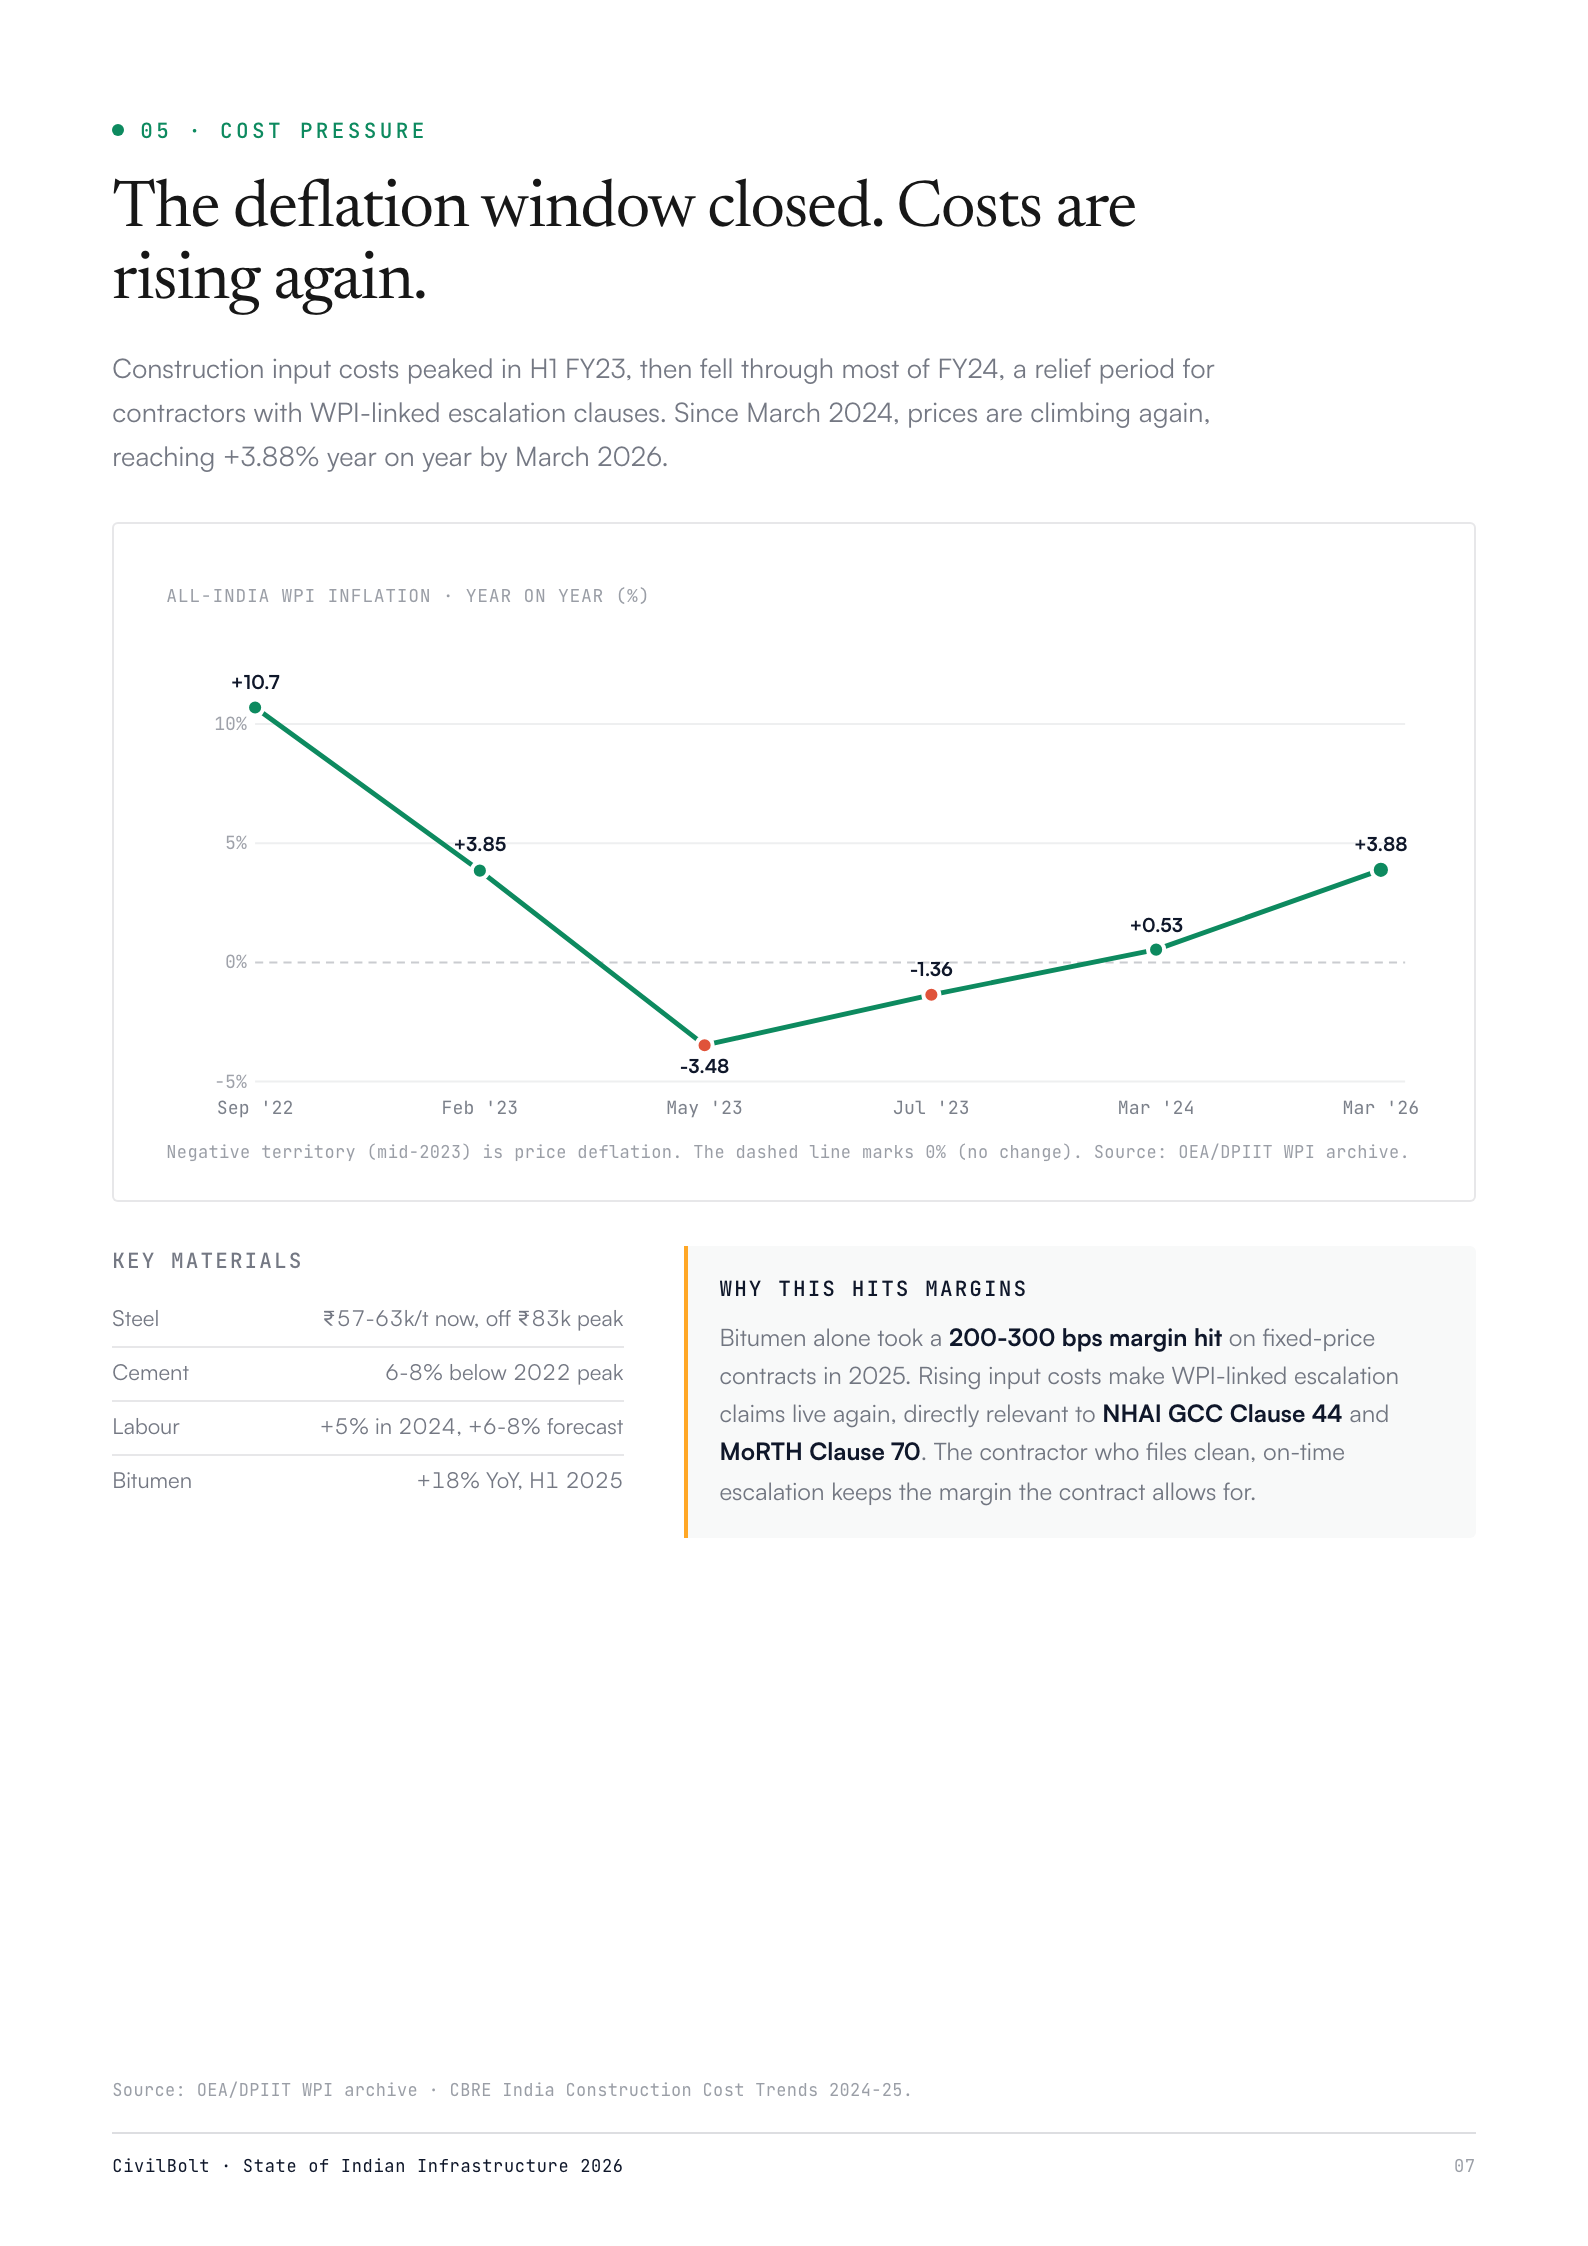
Cost pressure
The WPI trend and what it means for escalation claims.
Programme scorecard
Jal Jeevan, Smart Cities, AMRUT 2.0, and Railways, by the numbers.
The procurement market
CPPP and GeM volumes, and the construction GVA.
The outlook
Where the next packages open up, and how to win more of them.
Methodology & sources
Every figure, traced to its primary government source.
A look at the pages
Every figure, traced to its source.
The report draws only on primary government sources, SEBI-regulated company disclosures, and peer-reviewed research. No commercial market-size estimates unless clearly labelled. Each number in the PDF links to the document it came from. Reviewed quarterly; the next edition lands in 2027.
Primary sources
Get the 2026 report
We'll email you the PDF and send the next edition when it lands. No sales call required.